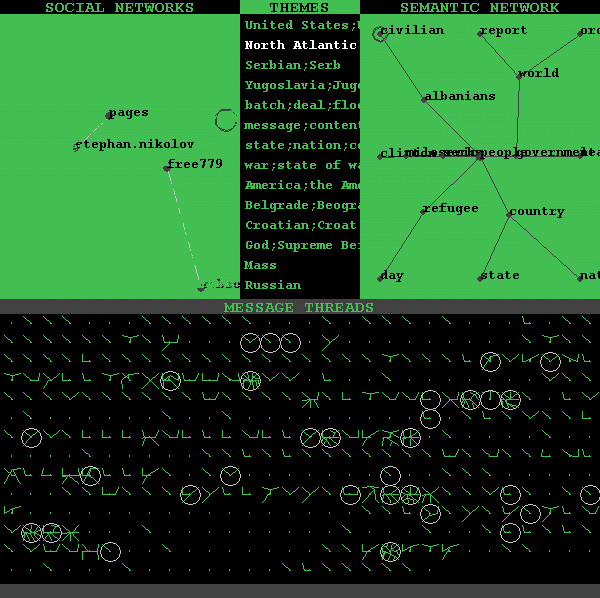
 Think about the last time you saw an Instagram photo, facebook post, or an online tweet by a celebrity. How many comments did it get? What about likes? Is it possible to turn that into a work of art? Warren Sack, Professor of Film and Digital Media at UC Santa Cruz[1], developed The Conversation Map in order to visualize a comment/reference chain of certain media posts within a forum or archive. The Conversation Map is an interface that analyzes archives and sites based on words and their relationship to each other[2]. Each line on the interface represents a connection or a citation to the post within an archive, like a Facebook, forum, or reddit post. A dot means that there is no reference or citation made to that specific post. The hottest conversations typically mean it would look more like a spider web of lines in contrast to a post with only one or two lines, representing one or two connections to it.
Much like Roy Ascott’s La Plissure du Texte (p125), Sack’s interface brings a whole different perspective on how networking is interpreted. While Ascott’s work provided a connection between groups, artists, and collaborators from all over the world, Sack’s work goes beyond looking at it as a simple connection and draws out a whole system of relations based on multiple conversations within an archive. The creation of the artwork is what makes Sack’s piece so complex, but the graphical component is simple to look at. In a sense, The Conversation Map provides a specific type of beauty. This type of beauty is similar to overseeing a busy city through the eyes of a pilot in a helicopter.
I would like to see this implemented in research, more specifically in published drafts and studies that doctors and scientists have done. It would show how important the publication or study is and how much of a specific department relies on the article that is being referenced. It can also give the author an idea of how many people are referencing his publication. This can give the author versatility and flexibility with their publication, possibly charging people to reference their work or running an algorithm to check the credibility of referenced posts.
Another addition that is welcome for this artwork is referencing downloads and views. This can also give corporations and businesses an idea of the type of traffic that comes across the post. Which people are commenting? Which ones are just viewing the post and ignoring it? This type of graphical interface can provide companies vital information for their business, much like Youtube’s analytics software.
1. http://web.media.mit.edu/~lieber/IUI/Sack/Sack.html
2. https://people.ucsc.edu/~wsack/
3. Roy ASCOTT La Plissure du Texte
See also Sack’s essay on the work in the journal Cabinet.
